
The PlanMyFIRE Planner
A spreadsheet that answers one question honestly: will the money last? Built on India's numbers, 6% inflation and healthcare at 10%, and it solves your corpus from the drawdown rather than multiplying your expenses by thirty and hoping.
Those are defaults, not rules. Every assumption in it is a blue cell you can overwrite: the returns, all four inflation rates, the withdrawal rate, your asset mix before and after retiring, even the age it plans to. Disagree with our numbers and use your own. The maths underneath re-solves either way.
Download the planner
Excel, Google Sheets or LibreOffice · no signup, no email
No macros, no network calls, nothing leaves your machine.
XLSX · 34 KB
On opening it: Excel opens downloads in Protected View. Until you click Enable Editing on the yellow bar, nothing you type recalculates. After that, fill in the blue cells with your numbers. The rest is sensible defaults or formulas you would not need to change. In case you want to, just Review → Unprotect Sheet.
Why a spreadsheet, when there are calculators
Fair question. We have a FIRE number calculator that runs in your browser and gives you an answer in about eight seconds. For most people that is enough.
But a browser calculator has to fit on a phone screen, which means it has to ask you three or four questions. Monthly expenses. Current corpus. Return assumption. Done. And your actual life has a school fee that stops in 2039, a home loan with seven years left on it, a parent whose medical costs are going one direction only, an EPF balance you cannot touch the way you touch a mutual fund, and a daughter's wedding you have half-decided to fund.
None of that fits in four input boxes. A spreadsheet has room.
The thing most sheets get wrong
Open any FIRE spreadsheet doing the rounds on Indian personal finance forums and you will find some version of this cell:
Corpus = Annual expenses ÷ 0.033
Thirty times your yearly spend. It is a clean rule and it comes from a real place, but as a target it has a problem: it assumes your spending is a flat line that rises at one rate forever.
Yours does not. Your school fees run for eleven more years and then go to zero. Your home loan EMI is fixed in rupee terms, so inflation eats it rather than growing it. Your health insurance premium at 70 will not resemble your premium at 45, and not because of general inflation alone. Divide by 3.3% and all of that gets flattened into one average that is wrong in both directions at once.
So the planner does the long version. It takes each stream of spending separately, grows it at its own rate, runs it for as long as that stream actually runs, discounts every one of those future rupees back to your FIRE date at your post-FIRE return, and adds up the lot. That sum is your corpus. It is a growing-annuity present value, which sounds worse than it is. The sheet does it in one cell and you never see the geometry.
The 3.3% figure still appears on the results panel, but as a rule of thumb sitting next to the real answer. If the two are far apart, that gap is telling you something about the shape of your spending.
FIRE Number Calculator
What's your FIRE number?
India-adjusted math: 3.3% SWR, 6% inflation. Plug in your expenses and get your corpus target.
A look inside before you download
Four tabs. You type into one of them. Here is the whole thing, so you know what you are opening.
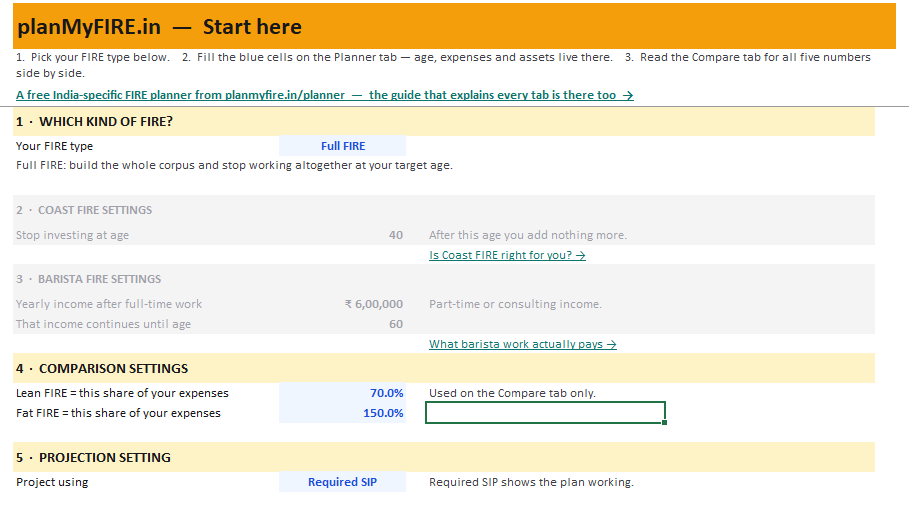
Start here
Pick Full, Coast or Barista FIRE. These are not variations on a theme, they are different plans with different failure modes, and whatever you pick flows through every other tab. The Coast settings grey out when you are not doing Coast. The last block decides whether the projection uses the SIP the plan needs or the one you actually do today.
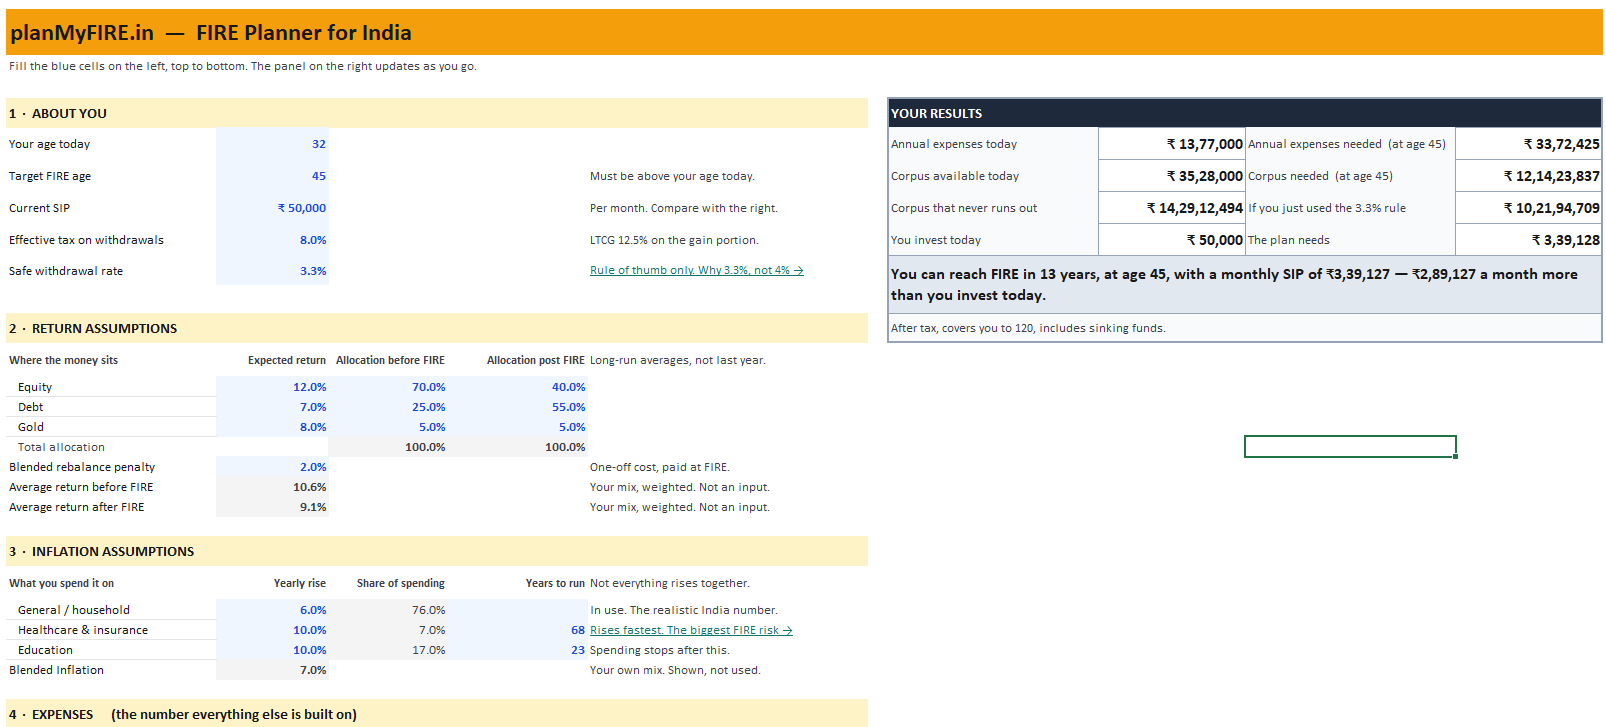
Planner: you and your assumptions
Blue cells are yours, everything else is locked so you cannot overwrite a formula and spend a week trusting a broken number. Age, target age, what you invest now, tax and withdrawal rate at the top. Then your asset mix before and after FIRE, in two columns, because most people de-risk at retirement and then forget to model the lower return that comes with it.
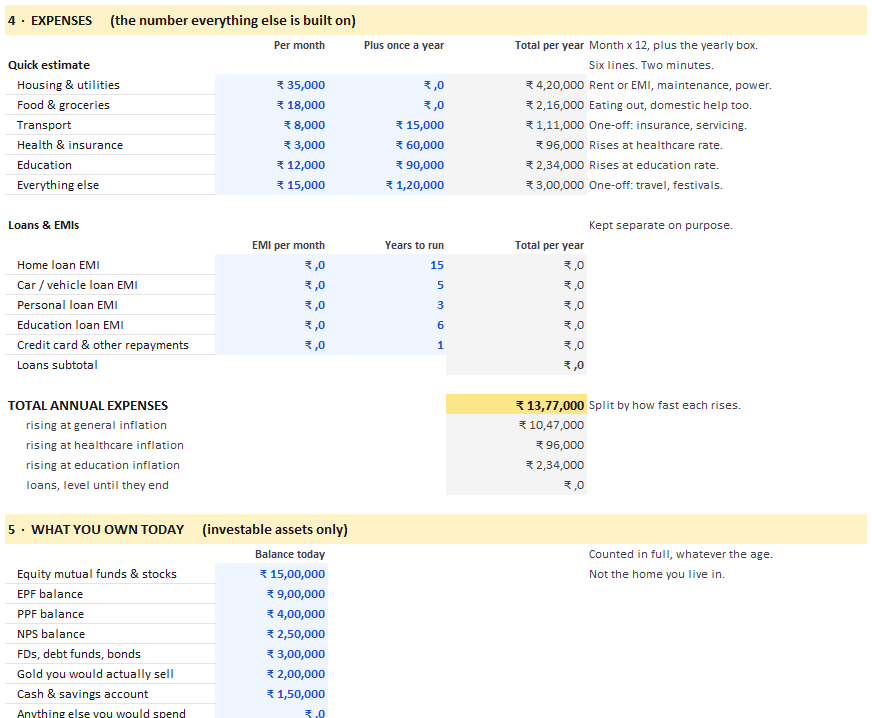
Planner: expenses and loans
Six lines, split by which inflation rate they follow rather than by category. Each takes a monthly figure and an optional once-a-year figure for the things that arrive as a lump, like insurance premiums and servicing. Loans sit in their own block with a years-to-run column, because an EMI does not inflate and it ends.
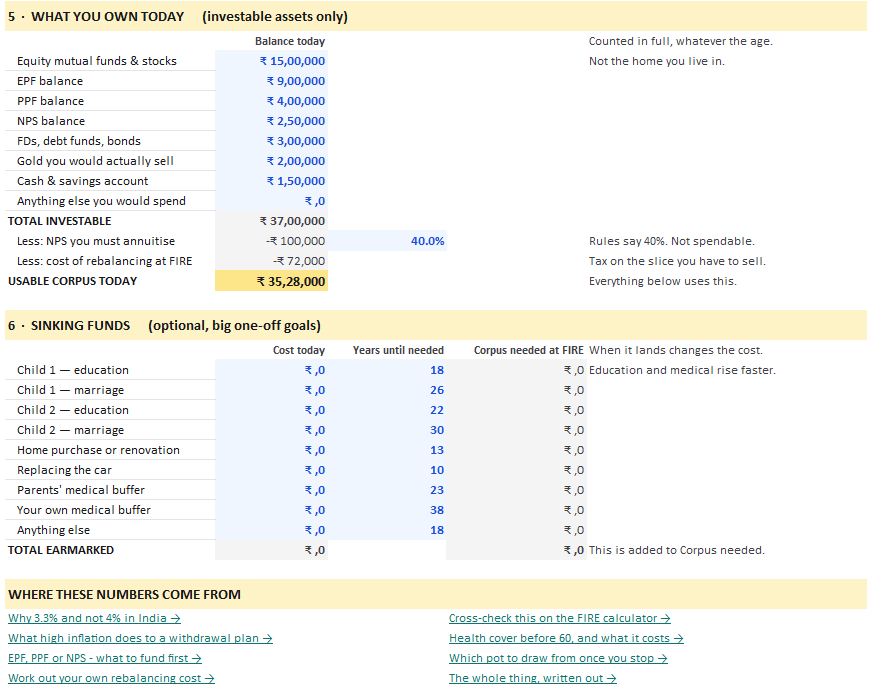
Planner: assets and goals
Investable assets only, not the flat you live in, because you cannot eat it and selling it means renting something else. Two deductions run underneath: 40% of NPS comes out, then a one-off rebalancing cost. Sinking funds below that take an amount in today's money and a number of years, and get inflated to the year they land.
Compare
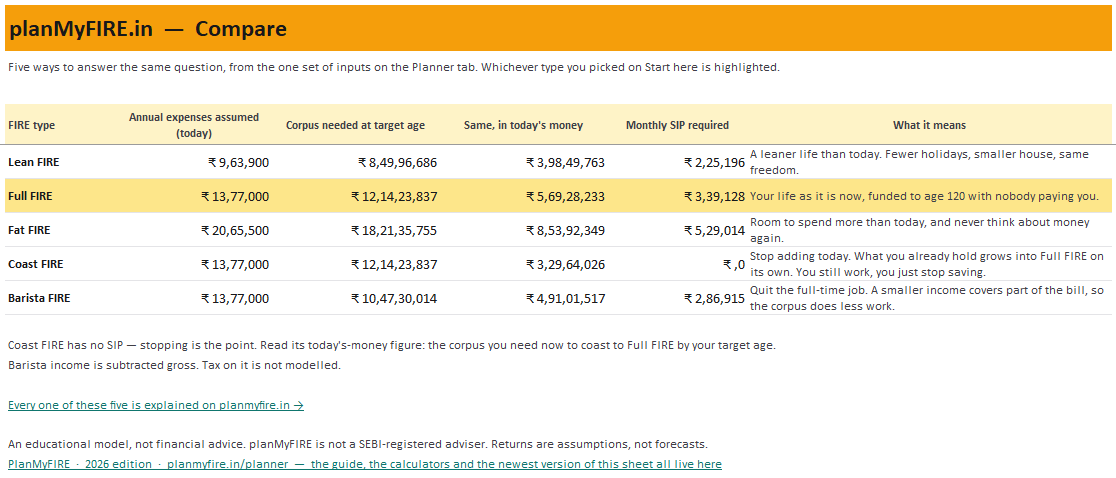
Five ways to answer the same question from one set of inputs. Corpus needed at your target age, the same figure in today's money, and the monthly SIP each one demands. Coast is the interesting row, because it asks for no SIP at all. Its today's-money figure is what you would need sitting there right now to stop investing and still arrive at Full FIRE on time.
Projection
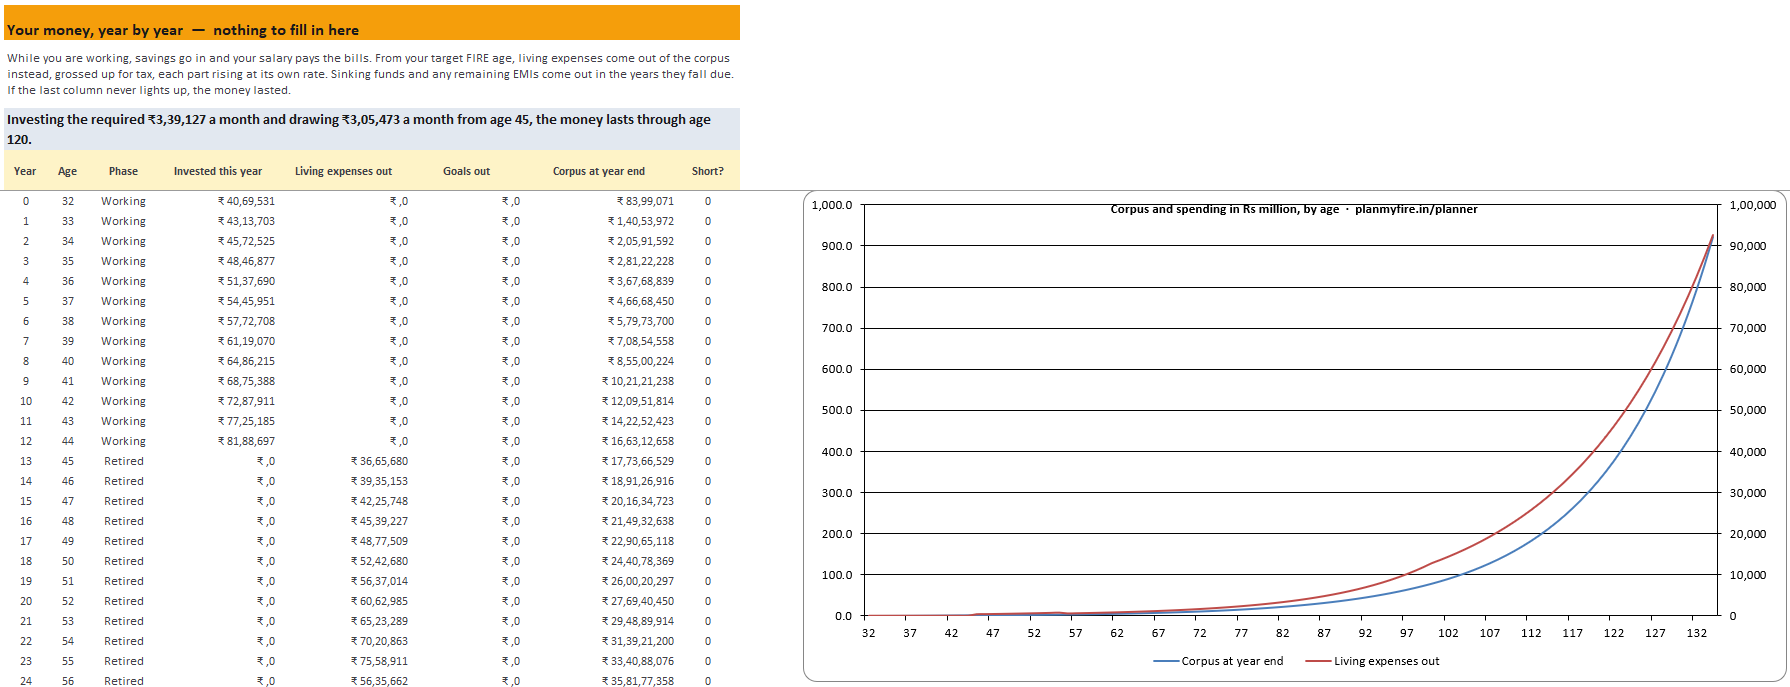
The tab that actually answers the question. One row per year to age 120: what went in, what came out, what is left, and a column that lights up red the first year you run short. If it never lights up, the plan works. That is the whole test. The chart puts your corpus against your spending so you can see where the curves cross.
The four things it does that others do not
- Spending that stops is modelled as stopping. Education ends after the span you set. Loans end. Healthcare runs hot until 100 and then settles to general inflation. A plan that charges you school fees at 85 is not being conservative.
- NPS is treated properly. 40% of your NPS corpus must buy an annuity, so the sheet takes it out of your spendable pot rather than quietly counting it.
- Retirement costs you something on the way in. Shifting from a growth mix to a drawdown mix means selling, and selling means capital gains. The sheet charges you for it once, at FIRE. Set it to zero if you plan to drift into the new allocation with fresh money instead. Most people will not.
- Two corpus figures, not one. One that lasts to 120, and one that never runs out at all. The gap between them tells you how much of your plan depends on dying on schedule.
A worked example
Sandeep is 32, works in Bengaluru, wants out at 45. Household, rent, travel and the discretionary stuff come to ₹87,250 a month. Health insurance and medical, ₹8,000. School fees, ₹19,500. That is ₹13,77,000 a year. He has ₹37 lakh invested across equity funds, EPF and a small NPS balance, and puts ₹50,000 a month into SIPs. No loans left.
The planner tells him two things he did not want to hear.
First, his corpus target is ₹12,14,23,837. Twelve crore, against the ₹4.13 crore he got from multiplying his annual spend by thirty. The difference is mostly healthcare compounding at 10% for the rest of his life, plus twenty-three years of school fees that his rule-of-thumb number had treated as either permanent or free depending on which way you squint at it.
Second, the SIP required to get there from ₹37 lakh in thirteen years is ₹3,39,127 a month. He is doing ₹50,000.
That is not a small gap and no amount of spreadsheet tuning closes it. What it does do is turn a vague ambition into a specific set of choices: retire at 52 instead of 45, or cut the general spending line, or take the Barista route and plan for ₹6-8 lakh of consulting income until 60. Each of those is one cell change away, and the sheet recalculates in front of him.
Switching him to Barista FIRE at 45 with ₹6 lakh a year until 60 pulls the corpus target down hard, because fifteen years of partial income means fifteen years the portfolio is not doing all the work. He still cannot do it at 45. He can nearly do it at 49. That is a more useful conversation than "you need 4.2 crore".
What it does not do
Every model is wrong somewhere. Four places this one is, and you should hear them now rather than find them at 60.
- Returns are flat. Twelve percent every year, forever. Markets do not work like that, and the order matters enormously. A bad first decade after you retire does far more damage than the identical returns arriving in your seventies, because you are selling units into a falling market to pay for groceries. Treat the answer as a target rather than a forecast, and keep two or three years of spending in something boring.
- NPS annuity income is not counted. The sheet removes 40% of your NPS from the spendable corpus, correctly. It then ignores the pension that 40% will pay you from 60 onwards, which is not correct, just conservative. If NPS is a large part of your portfolio, your real position is better than the sheet says.
- One return applies to every rupee. The sheet blends your allocation into a single rate and applies it to the whole portfolio. It does not know your EPF balance behaves like debt regardless of what your equity allocation says.
- Barista income is gross. No tax is modelled on it. Knock 20-30% off whatever you enter if you want the honest figure.
- It is a model, not advice. Nobody here is a SEBI-registered adviser.
Excel, Google Sheets, LibreOffice
Every formula uses functions that have existed since Excel 2007. No XLOOKUP, no LET, no dynamic arrays. That is a deliberate constraint and it is why the file opens in Google Sheets and LibreOffice without turning half the cells into errors.
Two things to know if you import to Google Sheets. Sheet protection does not carry over cleanly, so the locked cells become editable. Be careful what you click. And the chart on the Projection tab is a combined dual-axis chart, which is the most fragile part of any xlsx during an import. If it comes through looking odd, delete it and insert a fresh one from columns C, F and H. The numbers underneath are fine either way.
How to actually use it
Fill the Planner tab honestly, including the expenses you are slightly embarrassed about. Read the Projection. Then do the thing most people skip: go back to Start here, flip Project using to Current SIP, and look at the Projection again.
The first run tells you what the plan needs. The second tells you where you are heading. The distance between those two tables is your actual FIRE plan, and everything else on this site is about closing it.
SWP calculator
Will your corpus last through retirement?
Model your monthly SWP against inflation and market returns. See when - and if - it runs out.
Download the planner
Excel, Google Sheets or LibreOffice · no signup, no email
No macros, no network calls, nothing leaves your machine.
XLSX · 34 KB
On opening it: Excel opens downloads in Protected View. Until you click Enable Editing on the yellow bar, nothing you type recalculates. After that, fill in the blue cells with your numbers. The rest is sensible defaults or formulas you would not need to change. In case you want to, just Review → Unprotect Sheet.
Related reading: why we use 3.3% and not 4%, what high inflation does to a withdrawal plan, health cover before 60, EPF, PPF or NPS first, and which pot to draw from once you have stopped.
Not financial advice. planMyFIRE is not a SEBI-registered Investment Adviser. Calculator results are estimates based on historical assumptions and are for educational purposes only. Past market returns do not guarantee future performance. Consult a SEBI-registered adviser before making investment decisions. Terms of use.